
Microsoft Sentinel Threat Intelligence – Part IV – Using Workbooks

In my last blog post, I talked about how to use Threat Intelligence data along with Sentinel analytics rules. Today, I’m going to show you how to work with Workbooks to generate reports and dashboards, making it even easier to visualize TI data.
Azure Workbooks
If you are not familiar with Azure Workbooks, please check this link to learn more. As a quick intro, I’d like to share the explanation below directly from the Microsoft documentation:
Workbooks provide a flexible canvas for data analysis and the creation of rich visual reports within the Azure portal. They allow you to tap into multiple data sources from across Azure and combine them into unified interactive experiences. Workbooks let you combine multiple kinds of visualizations and analyses, making them great for freeform exploration.
Workbooks can also be used with Sentinel, where the SOC team can leverage the dashboards and visual representation, including trends and anomalies, helping them in their day-to-day work. One good example is the MITRE ATT&CK Workbook, which provides details about MITRE ATT&CK coverage for Microsoft Sentinel. Or the Cybersecurity Maturity Model Certification (CMMC), which provides a mechanism for viewing log queries aligned to CMMC controls across the Microsoft portfolio, including Microsoft security offerings, Office 365, Teams, Intune, Azure Virtual Desktop, and so on. Check out the list of Commonly used Microsoft Sentinel workbooks.
Threat Intelligence Workbook
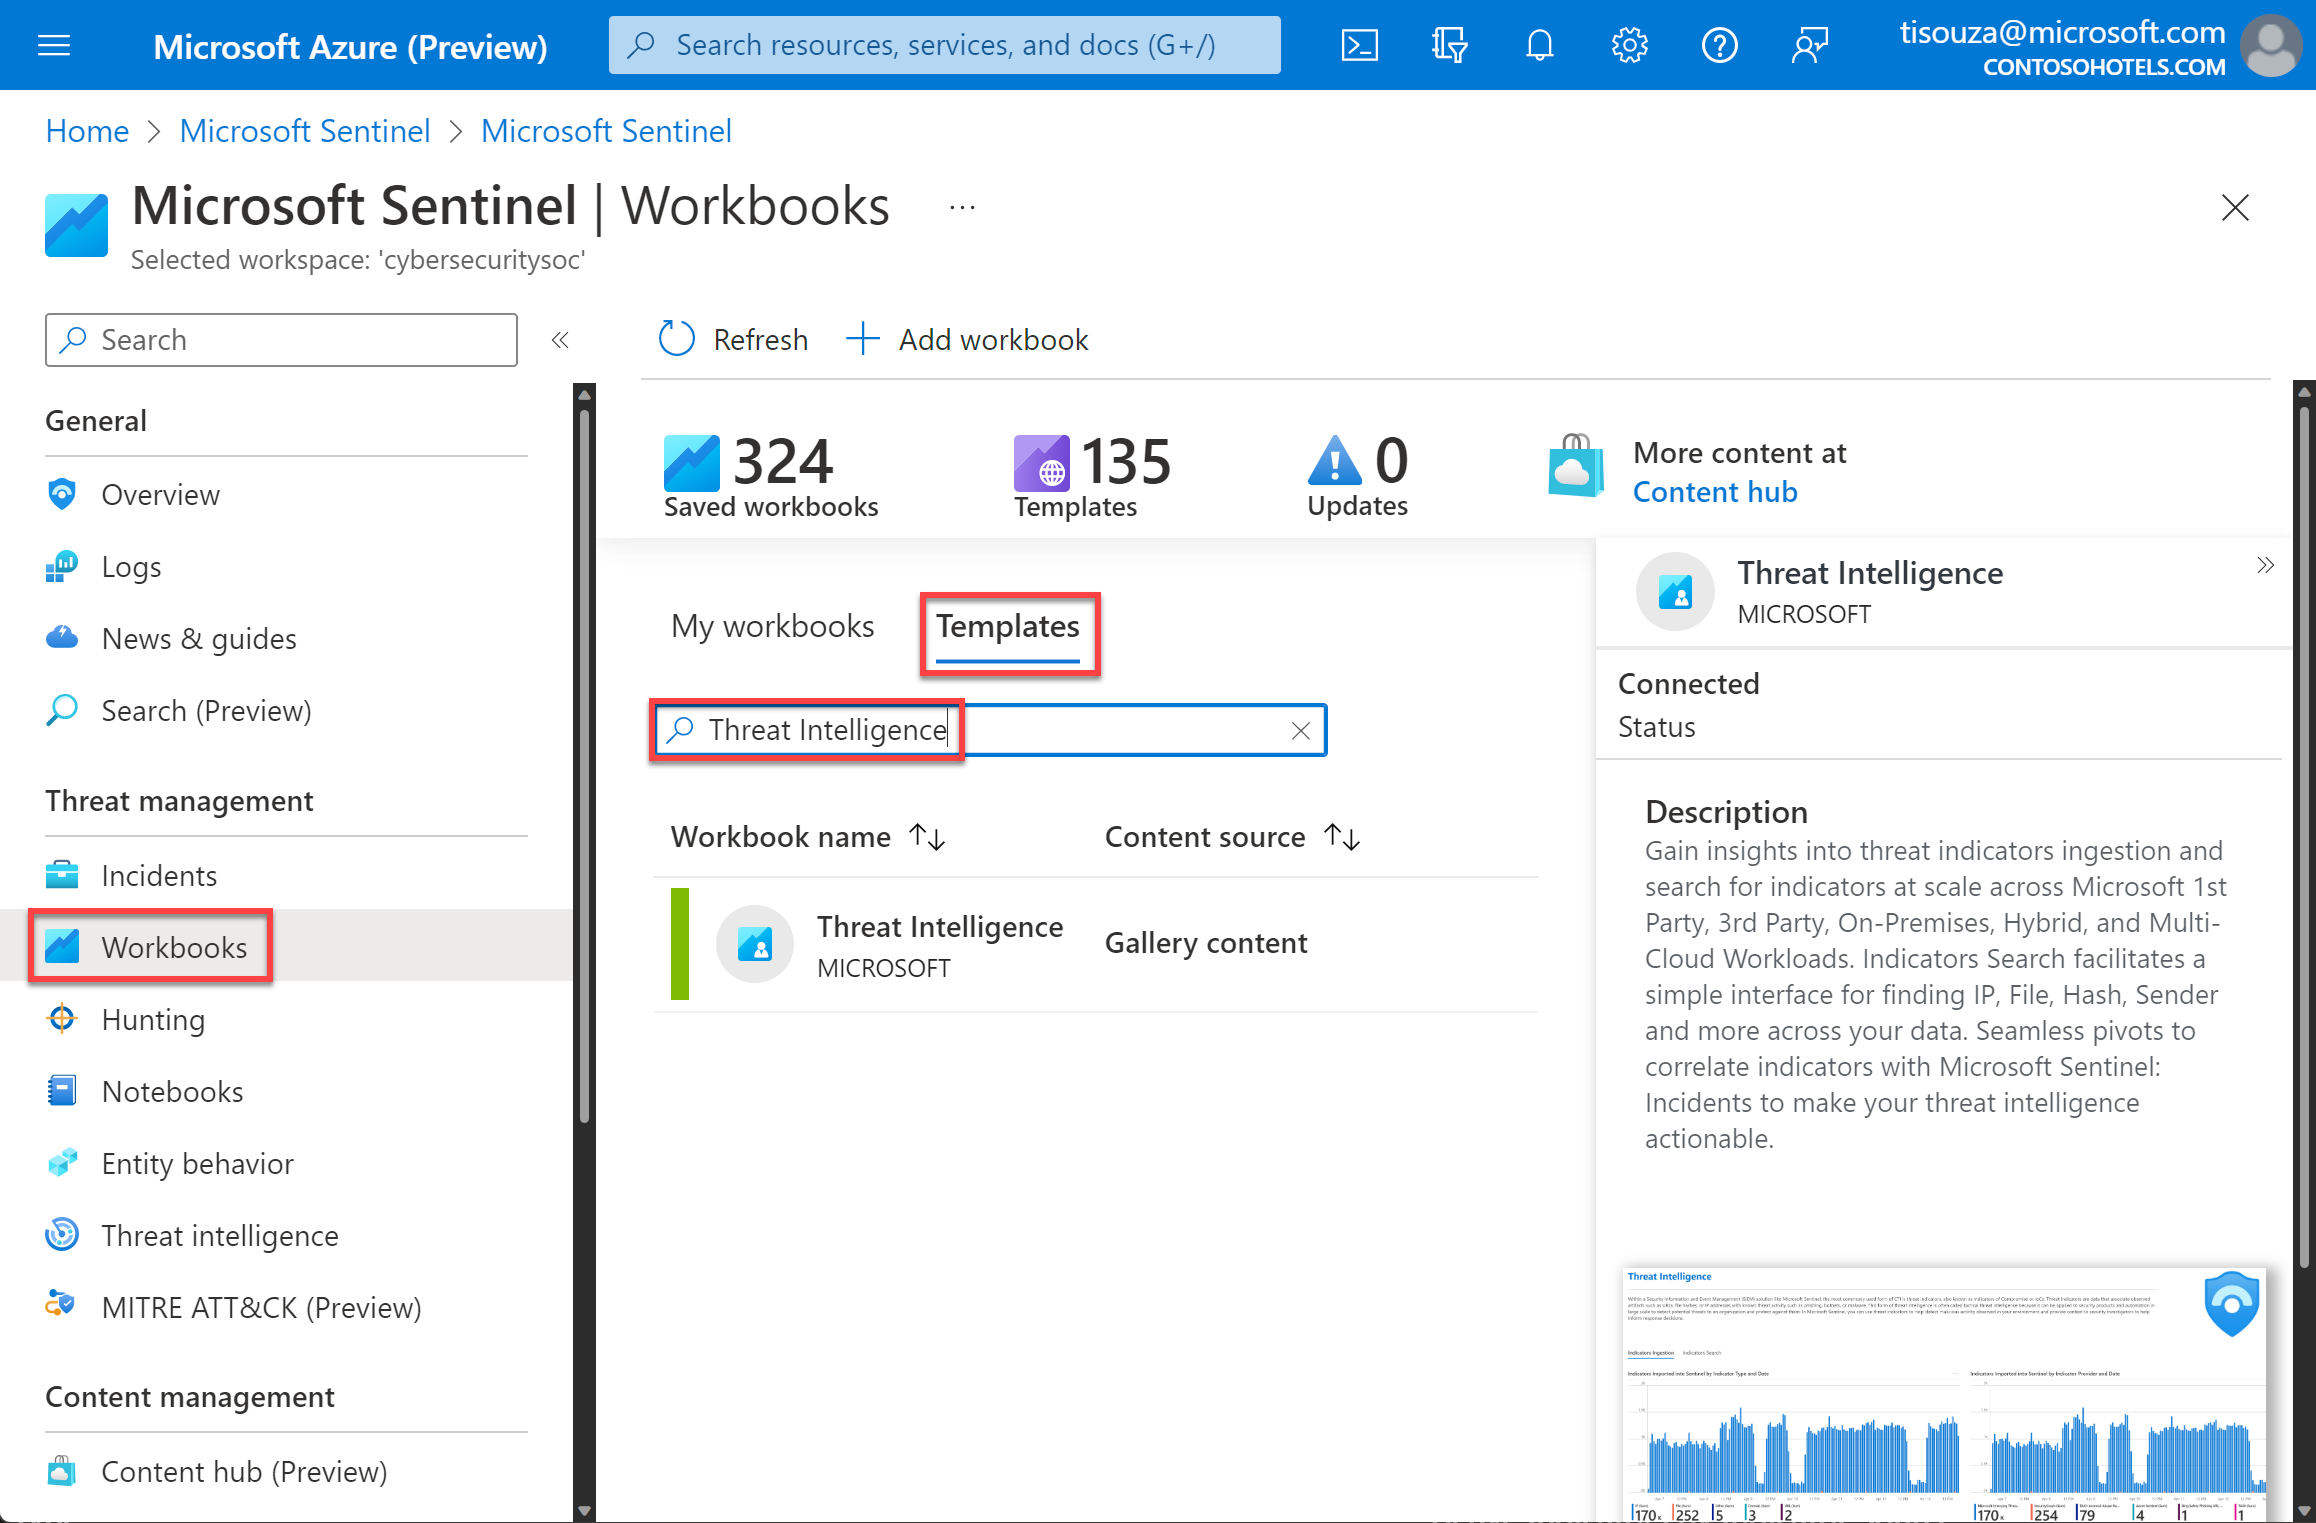
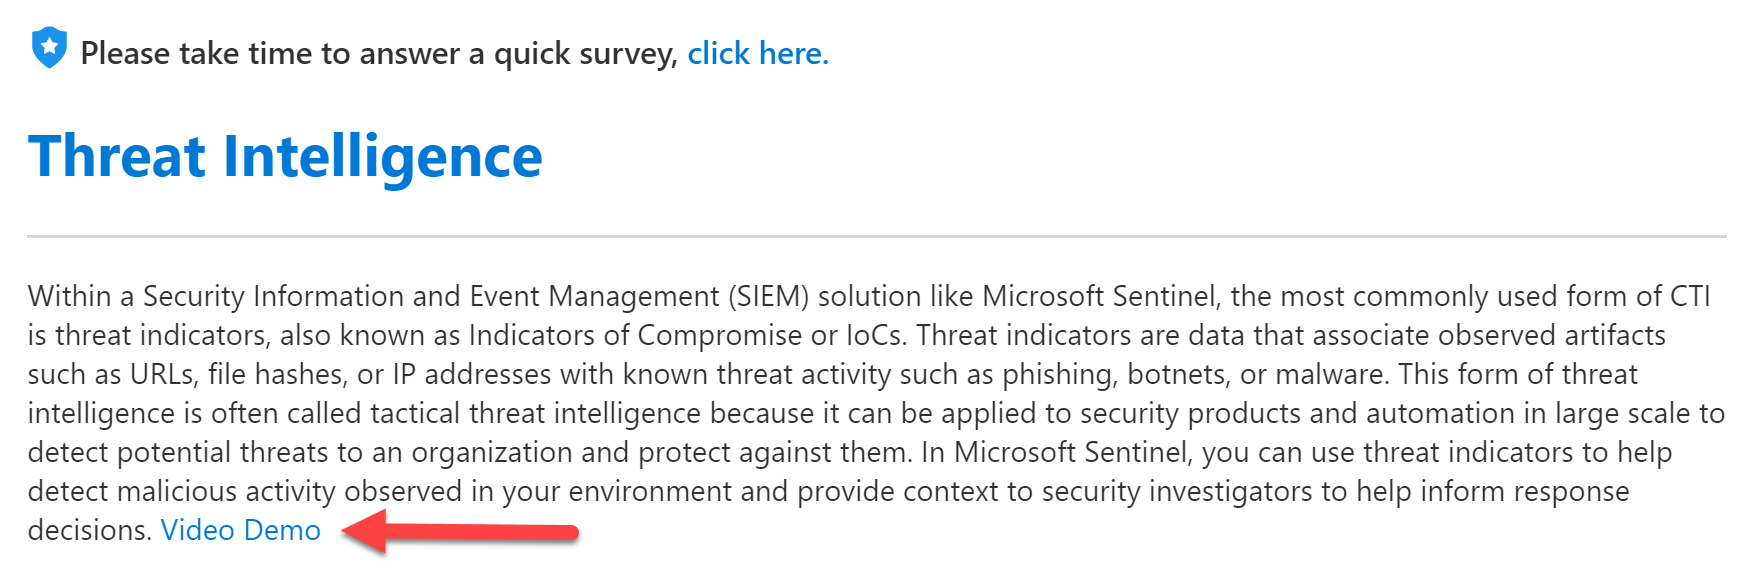
I want to talk today about the Threat Intelligence Workbook. This workbook will provide insights into threat indicators, including type, threat severity, activity over time, correlation with other data sources, and more.
To access the Threat Intelligence workbook, go to the Sentinel portal > Workbooks, search for Threat Intelligence, and save the workbook.
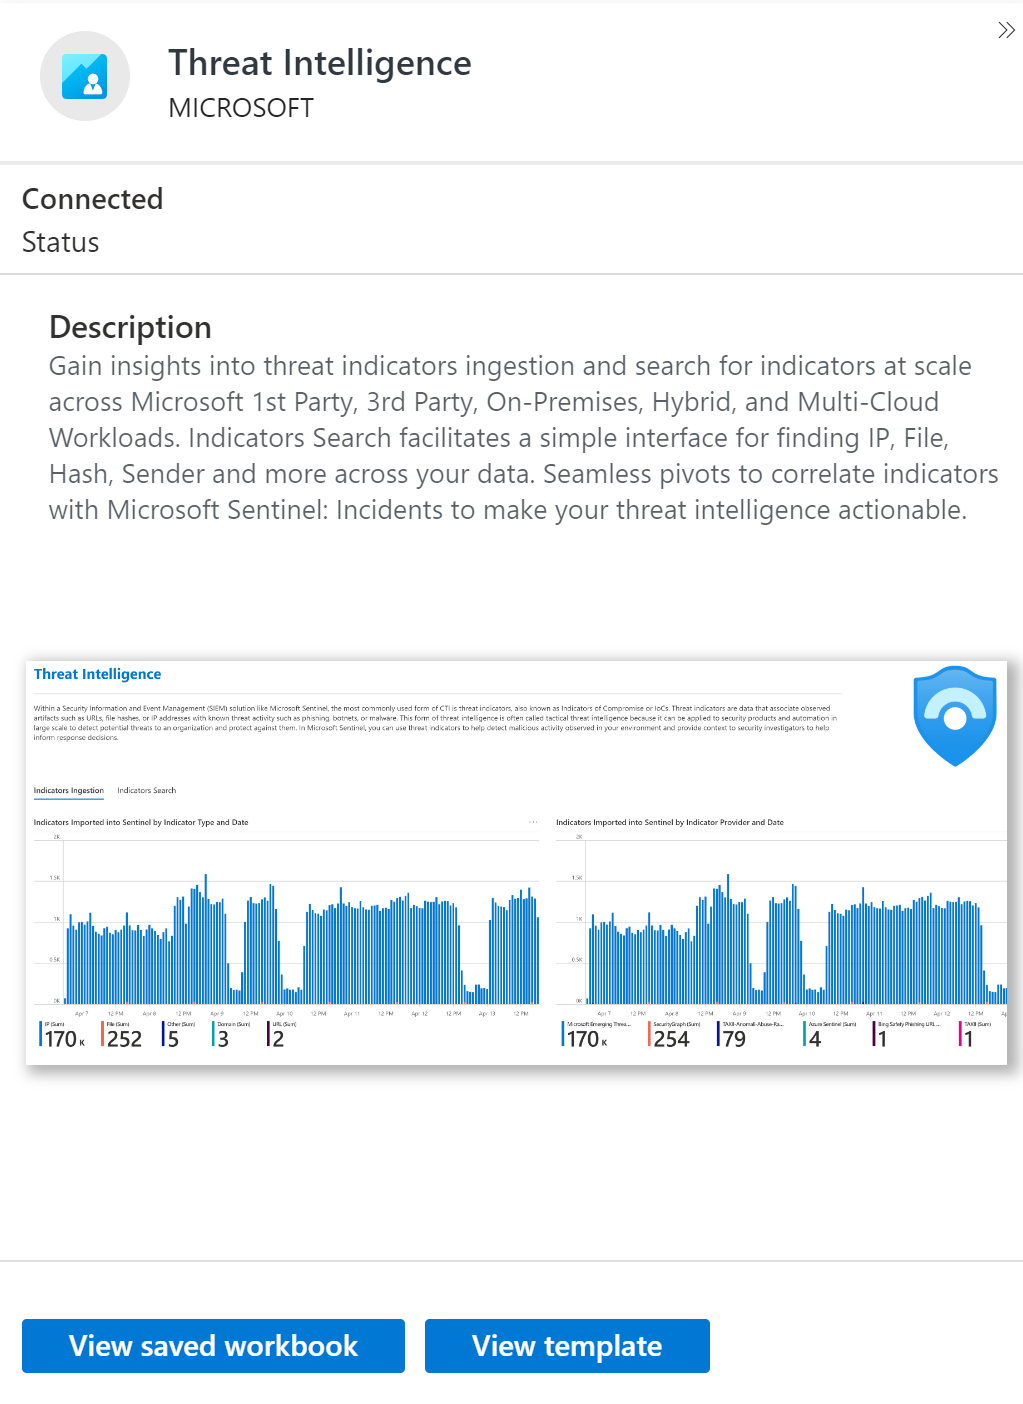
After saving it, select View Saved Workbook.
You’ll first see the menu to select the guide, subscriptions, workspaces, and time range.

After that, you will see two tabs. We can think of each one of these as sub-workbooks. For example, the first one, Indicators Ingestion, gives us an idea of the health and quality of these feeds, the indicators imported, threat feeds, and other indicators.


You can filter out indicators by Source, for example, SecurityGraph, Sentinel Indicators, or other types.

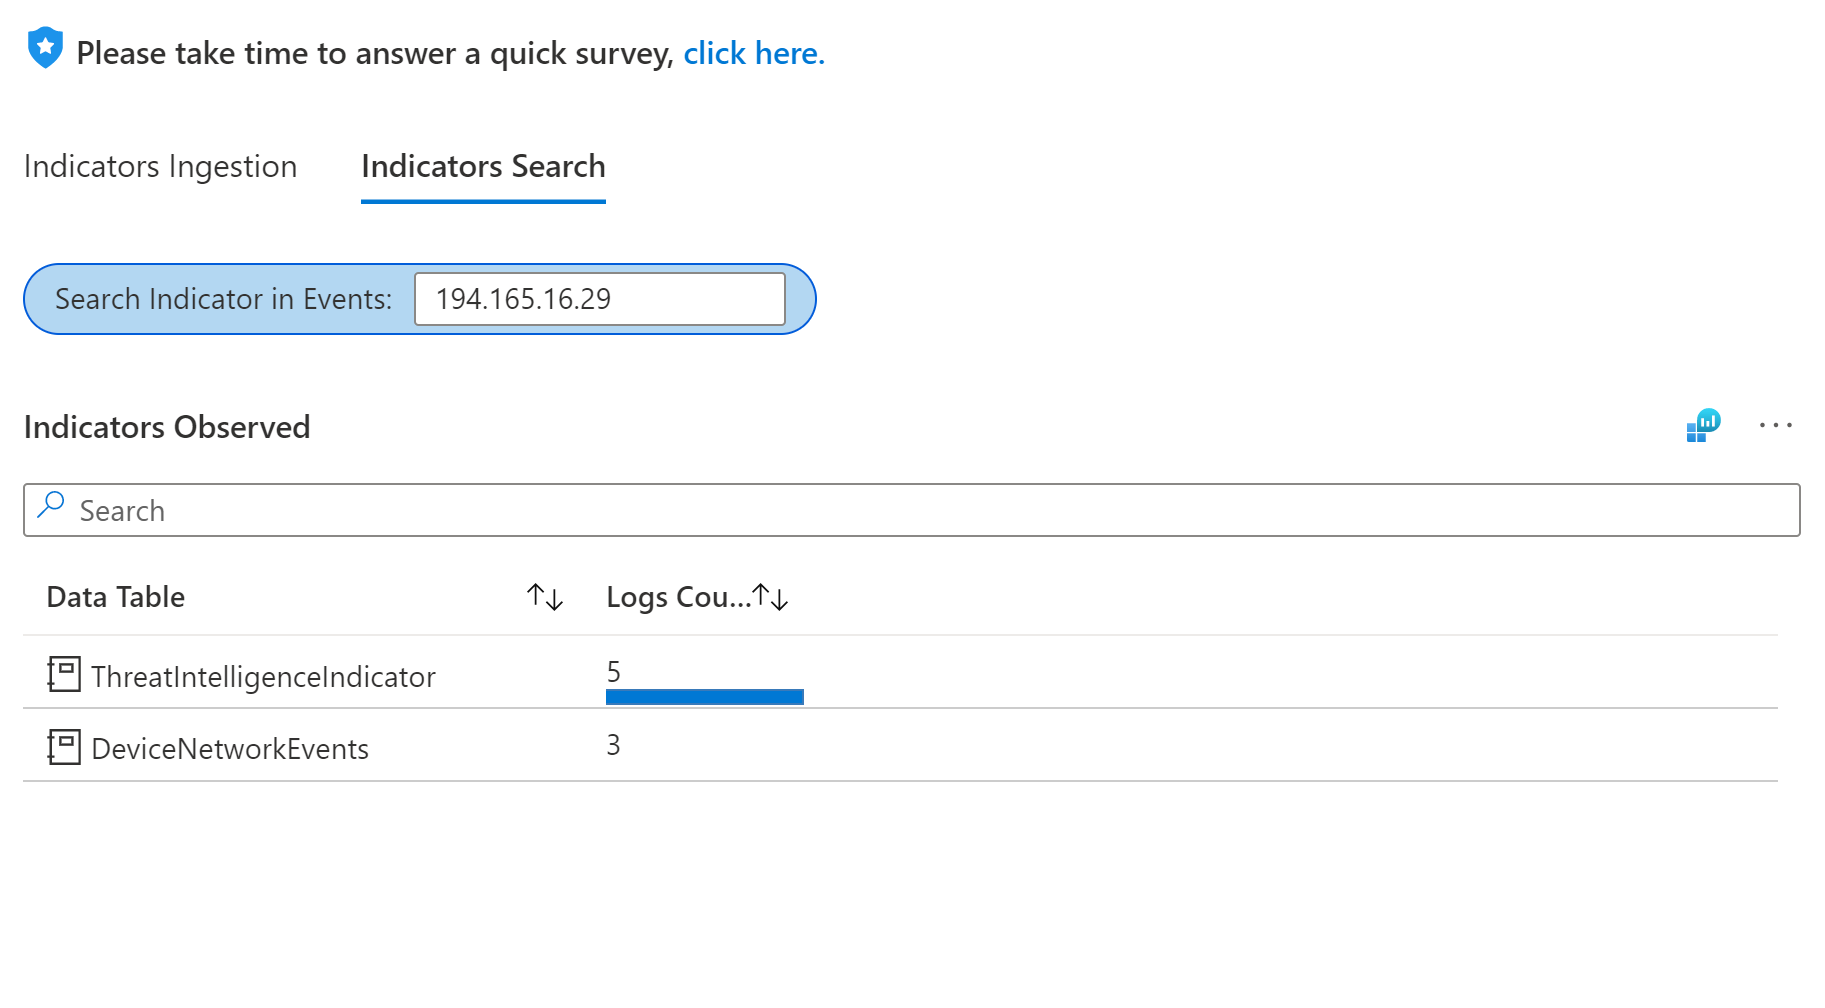
The other option is the Indicators Search. This is interesting because it makes the Workbook actionable. We can use this for free text search to hunt for IPs, hash, emails, etc., across 50+ Microsoft telemetry components.
I will show you here what happens when I search for an IP. You’ll see that this IP was found in two tables: ThreatIntelligenceIndicator and DeviceNetworkEvents. This means I have some indicators coming from my TI data, and I can see the same indicator in my device table. It’s vital to have the ability to search for these indicators in multiple locations, for example, in my cloud workloads, multi-cloud, on-premises, endpoints, emails, etc.
We also have on the same screen, Indicators Over Time, which shows the number of indicators in a time-based story.

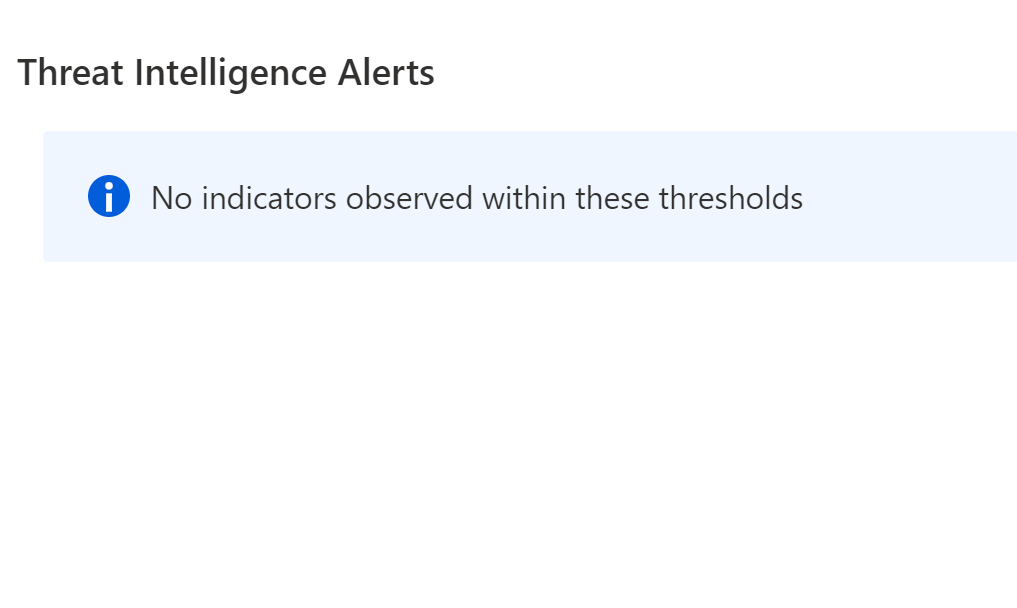
Here we have the Threat Intelligence alerts and their threat types, source, description, and more, to give you visibility if this indicator you are searching for here is part of an alert.

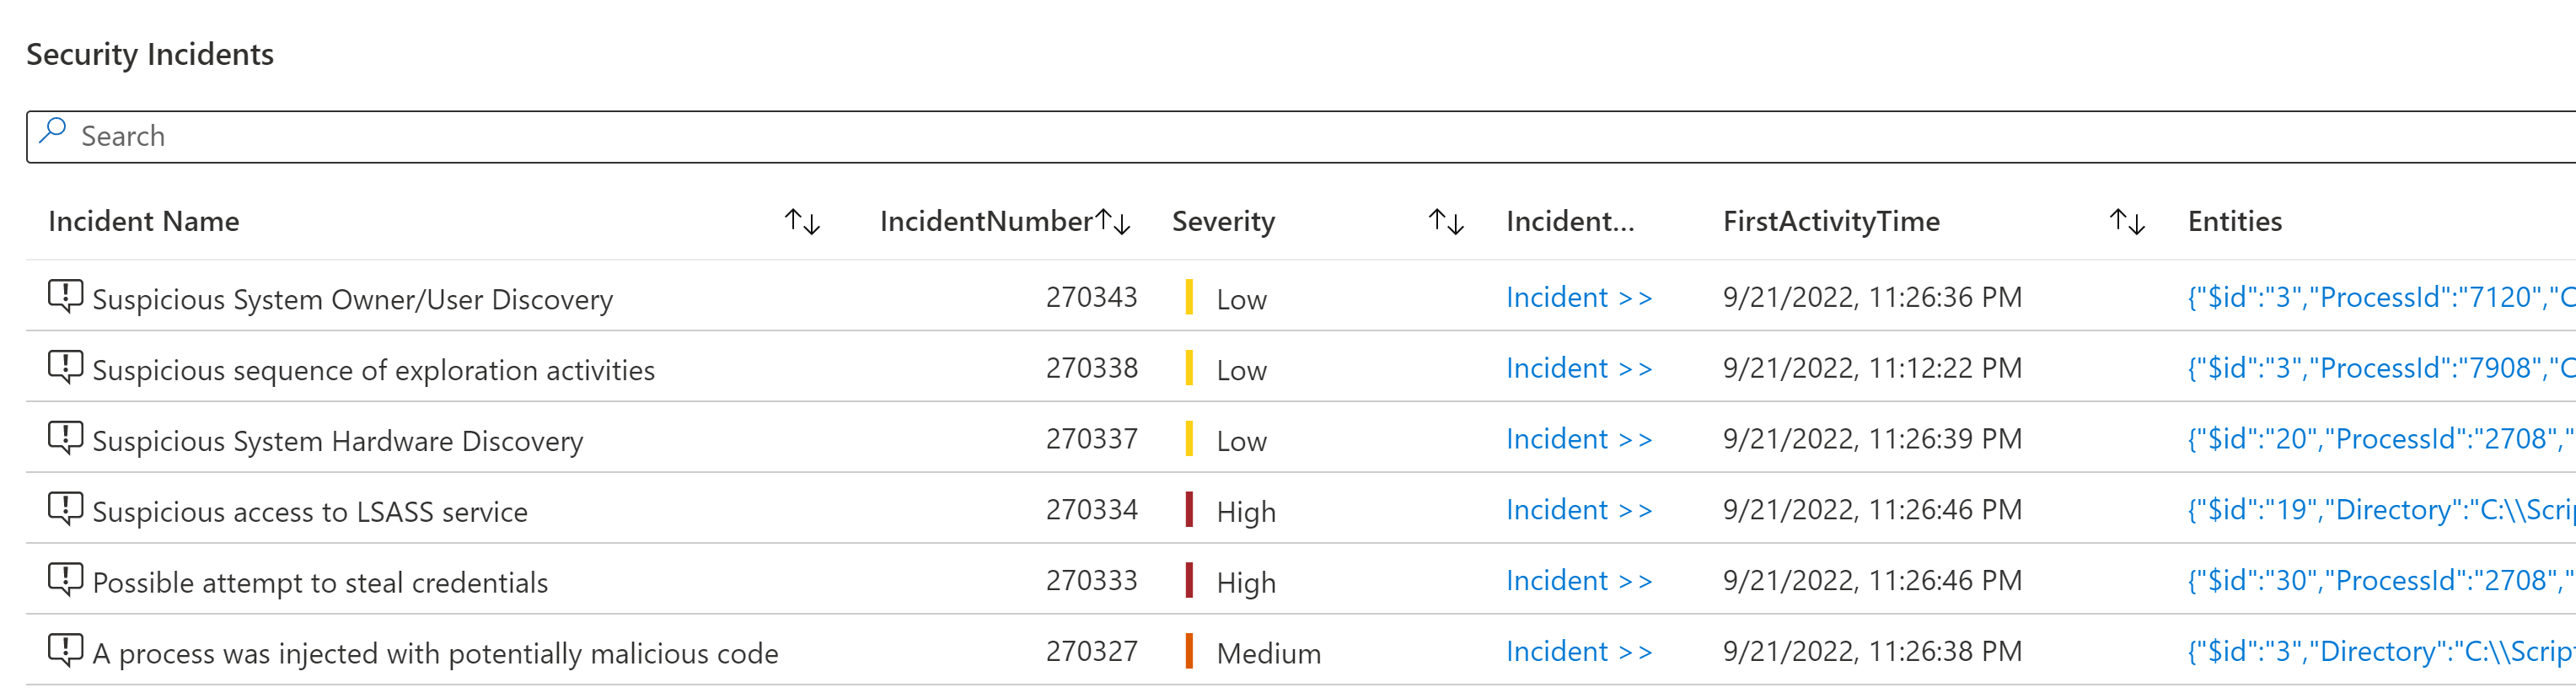
Finally, we can see the associated incidents of this indicator we are searching for in this example. In my case, the IP searched earlier is associated with two incidents. So here we have a good starting point to dive deeper into our investigation.

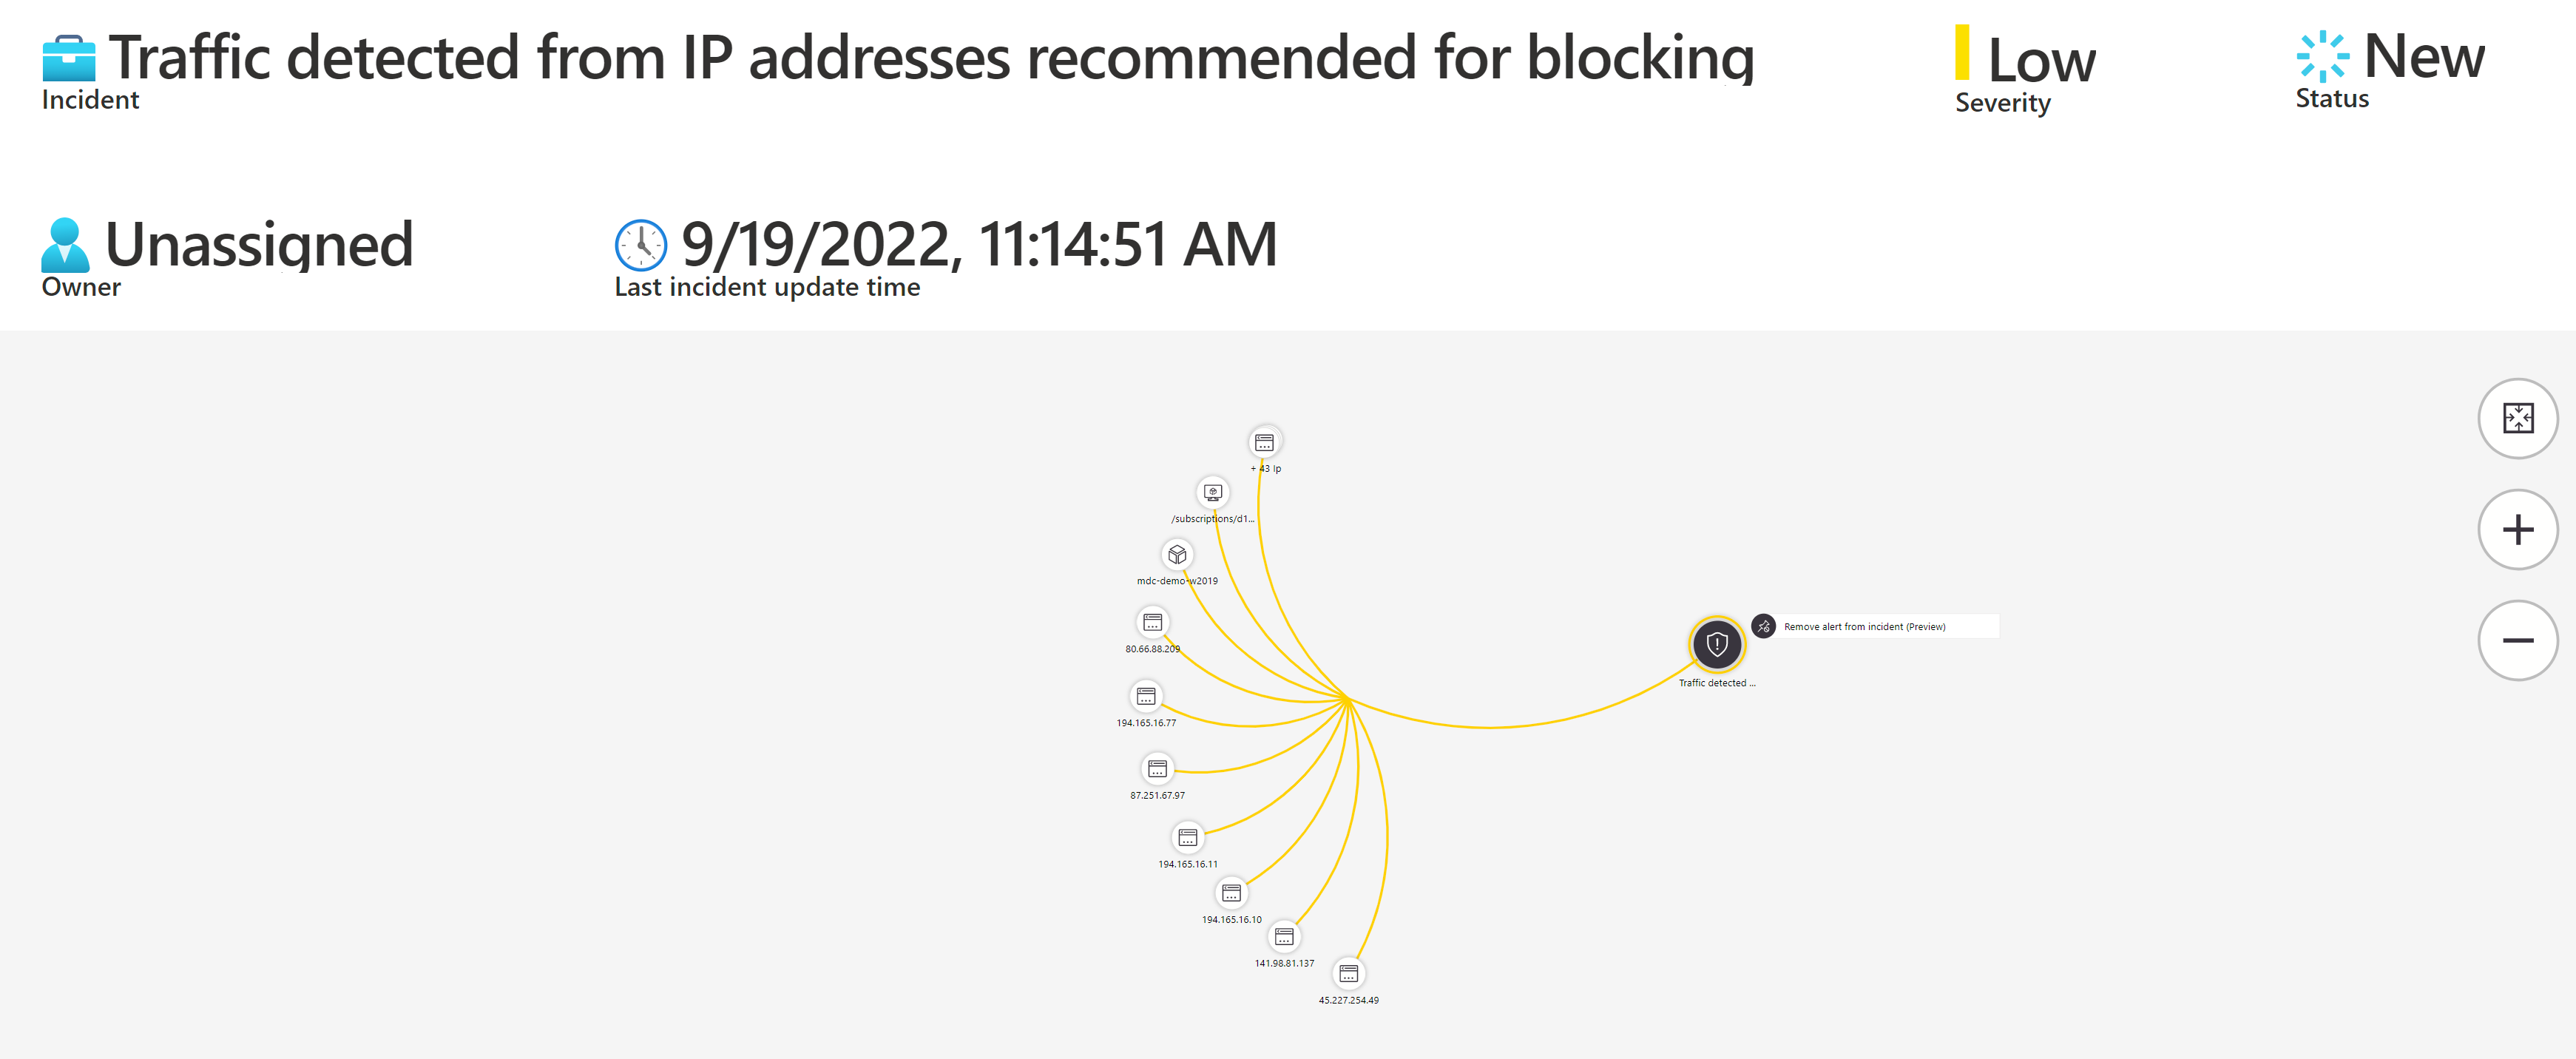
If I select the first incident, I will be taken to the Sentinel investigation page to begin my investigation process. We can quickly observe that this is traffic detected from a TOR IP address, identified by Microsoft Defender for Cloud.
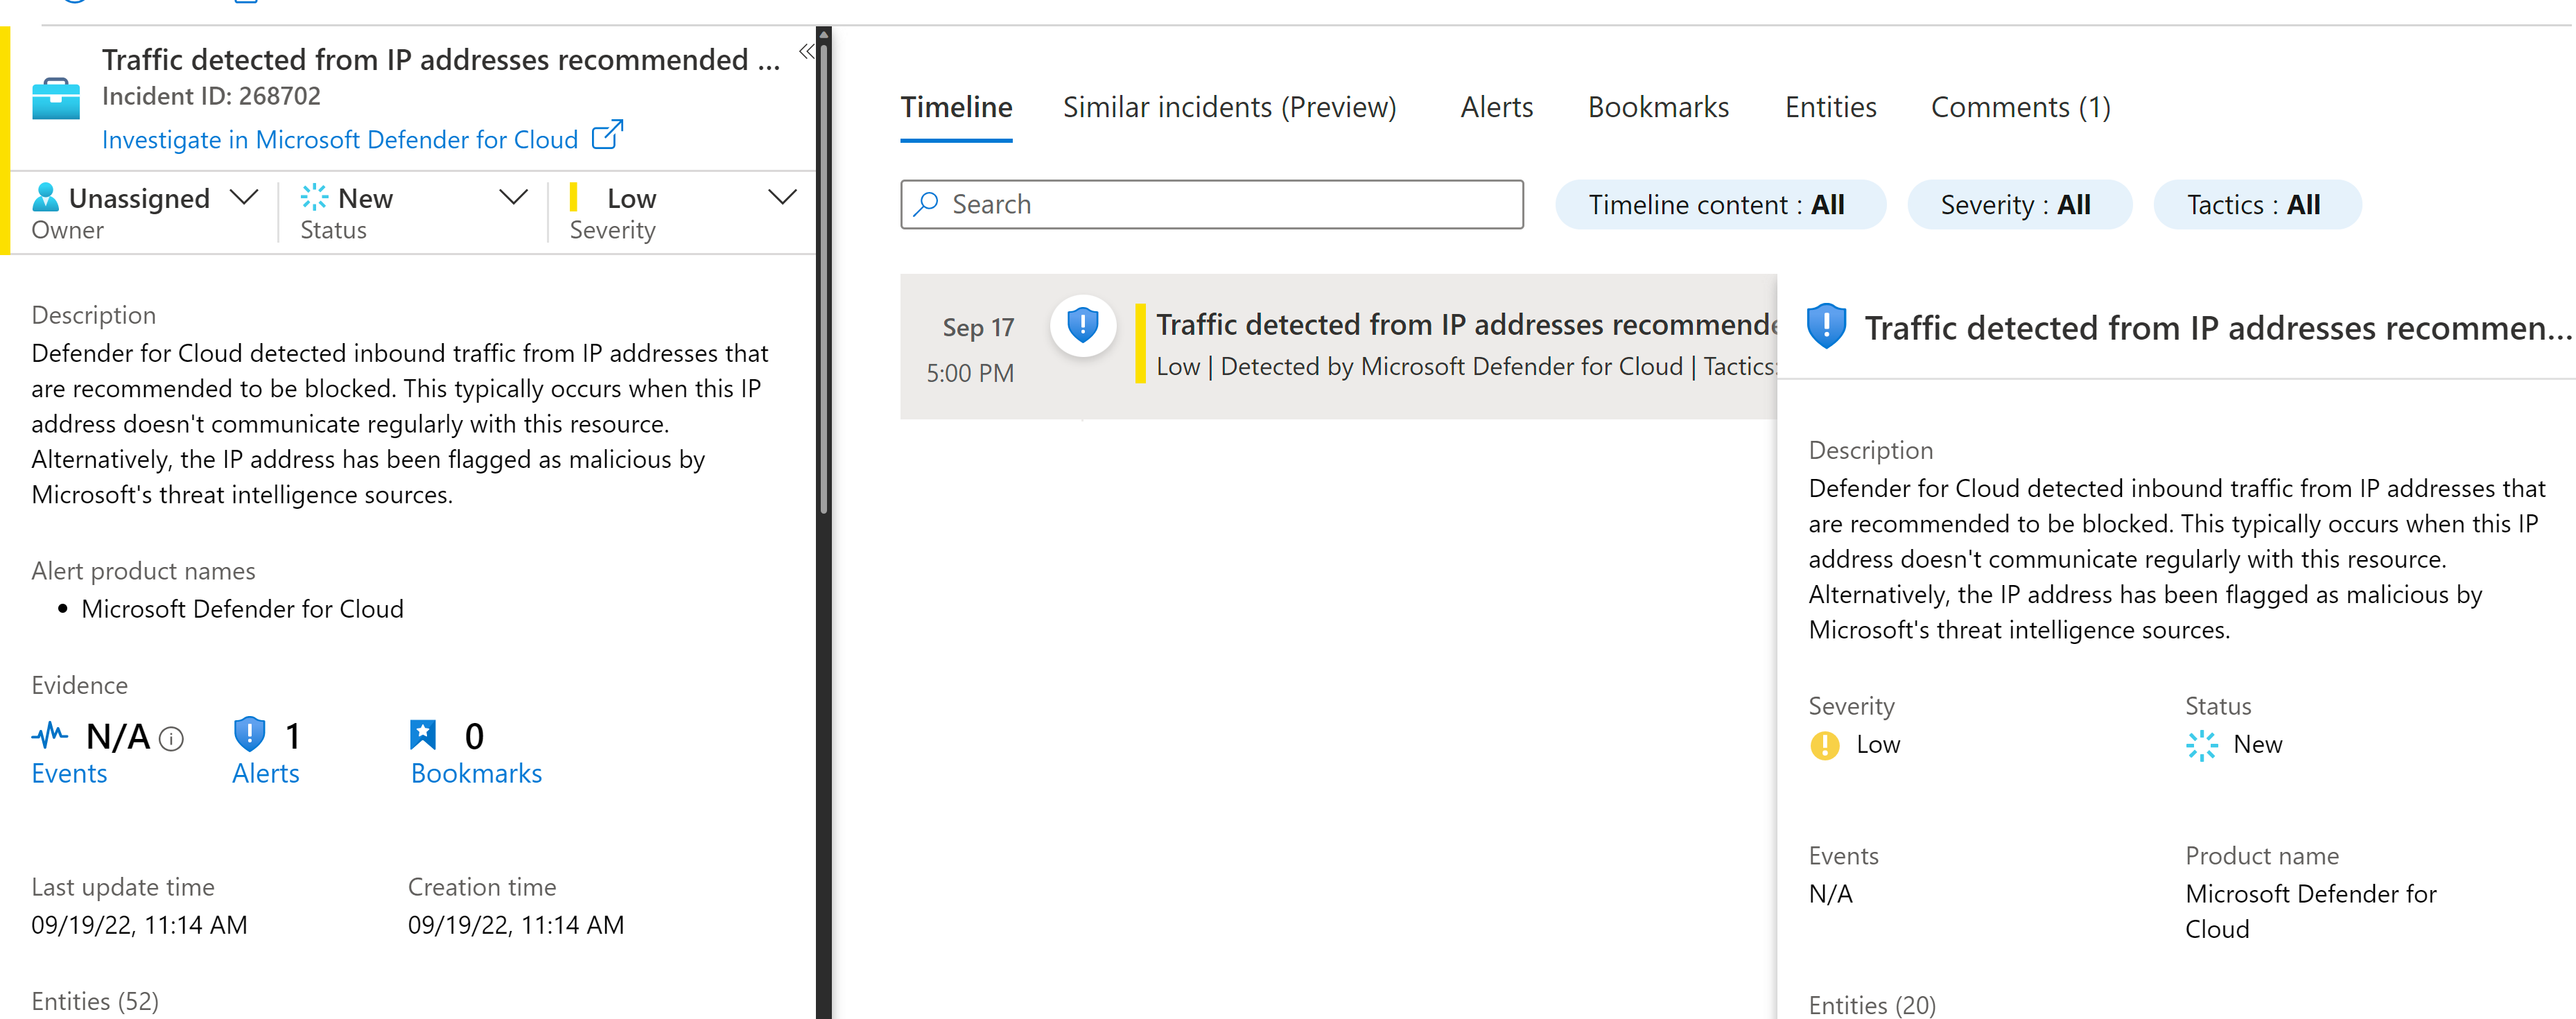
From here, I can select Investigate to expand the investigation on Sentinel.
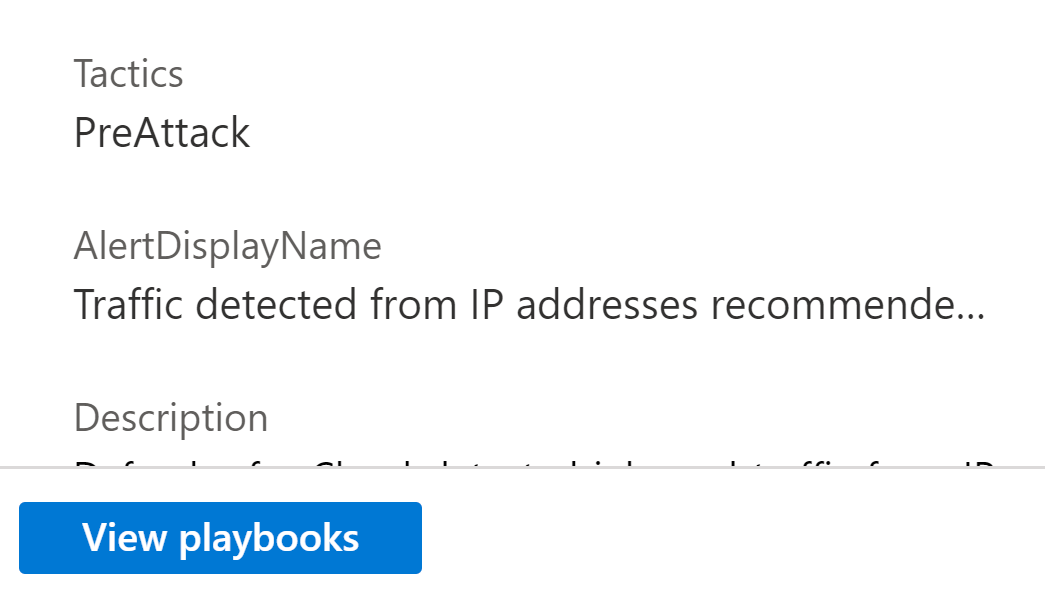
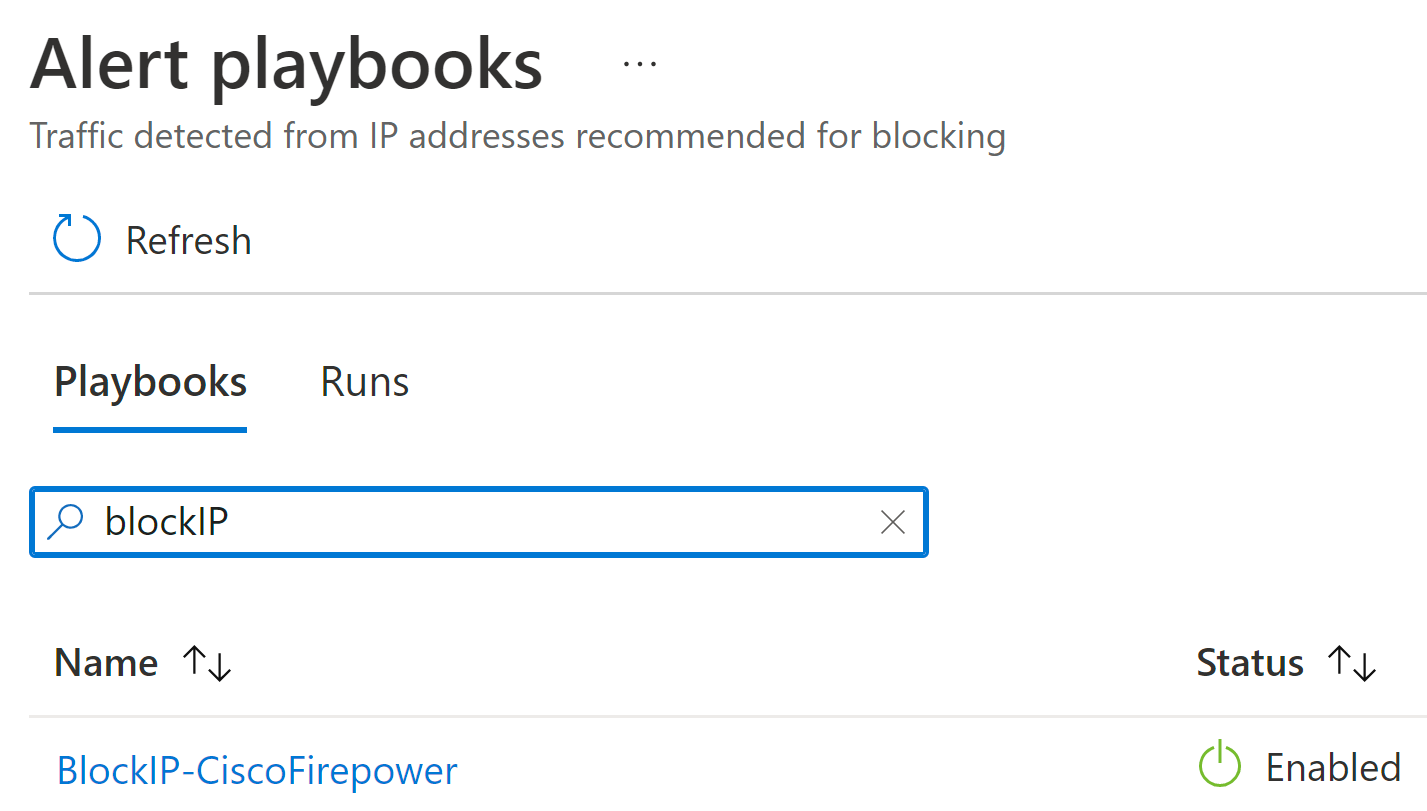
Note that we came from the Workbook page and now we are on the screen navigating through the incident, and we can even take some actions from here in the same portal. For example, if I want to select this entity (IP) and run a playbook that I previously created, I can select View Playbooks and pick one of the playbooks. In this case, I can choose a playbook to block the IP on the Cisco device.
Let’s see what happens when I want to search for a popular malicious process like mimikatz. We can easily see the tables where mimikatz was found.
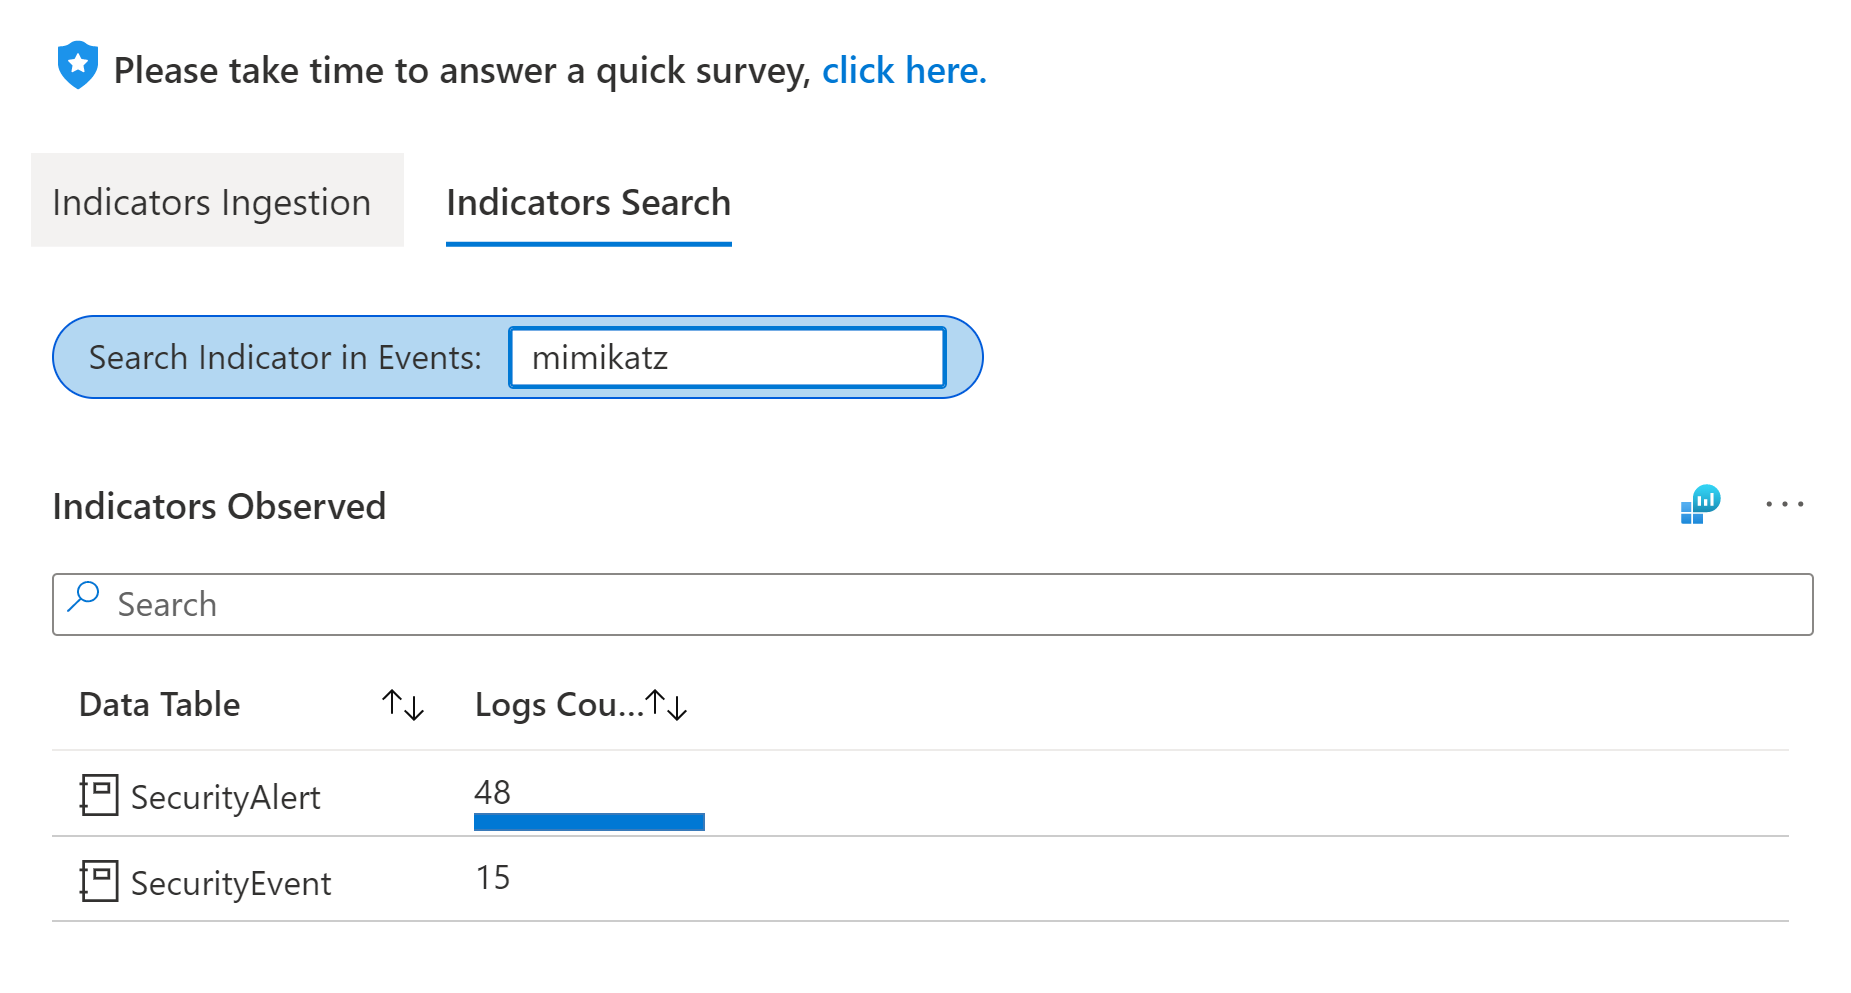
You’ll notice that we can’t see any threat intelligence alerts for this IP.
However, in the same Threat Intelligence workbook, we can quickly find the incidents related to this process.
Mi final tip – If you want to learn how to use the workbook, please check the link to the video on the workbook page. In the video, TJ Banasik, Principal Product Manager, demonstrates the possibilities with this workbook in more detail.
I am also sharing the video embedded right down here below:
Thank you for your visit!


